Choosing the right NIR and NDVI thresholds
The selection of the correct NIR and NDVI thresholds is a crucial step in the river segmentation process. This process is curcial since it will improve the accuracy of the segmentation. Also, this threshold calibration will reduce significantly the amount of manual corrections required after the segmentation is produced.
The SERIF toolbox provides the options of input individual thresholds for each image. These thresholds must stored
in the form of CSV files whitin the same folder as the image. The threshols definition and the further obtention of the
CSV files can be done usint the following script:
import os
import sys
import numpy as np
import rasterio as rio
sys.path.append(r"path/to/your/SERIF/toolbox")
from src.visualisation import Visualisation

# Initial thresholds to start the calibration
NIR_THRESHOLD = 77
NDVI_THRESHOLD = 0.2

def list_tifs(path: str):
    files_list = []
    for file in os.listdir(path):
        if file.endswith(".tif"):
            files_list.append(file)
    return files_list

def export_file(name: str, thereshold: tuple):
    # Extract file from tif image
    split_path = os.path.split(name)
    file_name = split_path[1].replace(".tif", ".csv")
    file_output_path = os.path.join(split_path[0], file_name)
    data = {
        "image_name": file_name.replace(".csv", ""),
        "ndvi": thereshold[0],
        "nir": thereshold[1]
    }
    # [file_name.replace(".csv",""),thereshold[0],thereshold[1]]
    # col_names = ["image_name","ndvi","nir"]
    df = pd.DataFrame(data=data, index=[0])
    df = df.set_index("image_name")
    # if not os.path.exists(file_output_path):
    df.to_csv(file_output_path, sep=",")

def main():
    # Set the paths to the photos
    photos_path = r"path/to/your/photos"
    center_line_path = r"path/to/your/centerline/shapefile.shp" #This shapefile must be in the same CRS as the photos
    files_list = list_tifs(photos_path)
    visualisation = Visualisation(center_line_path)
    for file in files_list:
        img_path = os.path.join(photos_path, file)
        with rio.open(img_path) as src:
            visualisation.dataset_rio = src
            extent_clip = visualisation.intersect_tif_and_shp()
            # Get bands
            red :np.ndarray = src.read(1)
            nir :np.ndarray = src.read(4)
            # Clip bands
            red = red[extent_clip.loc[0, "Index"]:extent_clip.loc[2, "Index"],
                    extent_clip.loc[1, "Index"]:extent_clip.loc[3, "Index"]]
            nir = nir[extent_clip.loc[0, "Index"]:extent_clip.loc[2, "Index"],
                    extent_clip.loc[1, "Index"]:extent_clip.loc[3, "Index"]]
            ndvi = (nir.astype(float)-red.astype(float)) / \
                (nir.astype(float)+red.astype(float))
            ndvi[np.isnan(ndvi)] = np.nan
            rgb = visualisation.get_RGB(src, extent_clip)
            mask_nir = np.where(nir < NIR_THRESHOLD, 1, 0)
            mask_ndvi = np.where(ndvi < NDVI_THRESHOLD, 1, 0)
            # Refine NIR mask
            mask_nir = np.where((mask_ndvi == 1) &
                                (mask_nir == 1), 1, 0)
            # Get total mask
            mask_ = mask_nir + mask_ndvi
            mask_ = mask_.astype(float)
            mask_[mask_ == 0] = np.nan
            ndvi_threshold, nir_threshold = visualisation.calibrate_threshold(rgb, mask_,
                                                                            ndvi, nir,
                                                                            NIR_THRESHOLD,
                                                                            NDVI_THRESHOLD)
            export_file(img_path, (ndvi_threshold, nir_threshold))
Once the script is run, you will see that a figure will pop in your screen like the following:
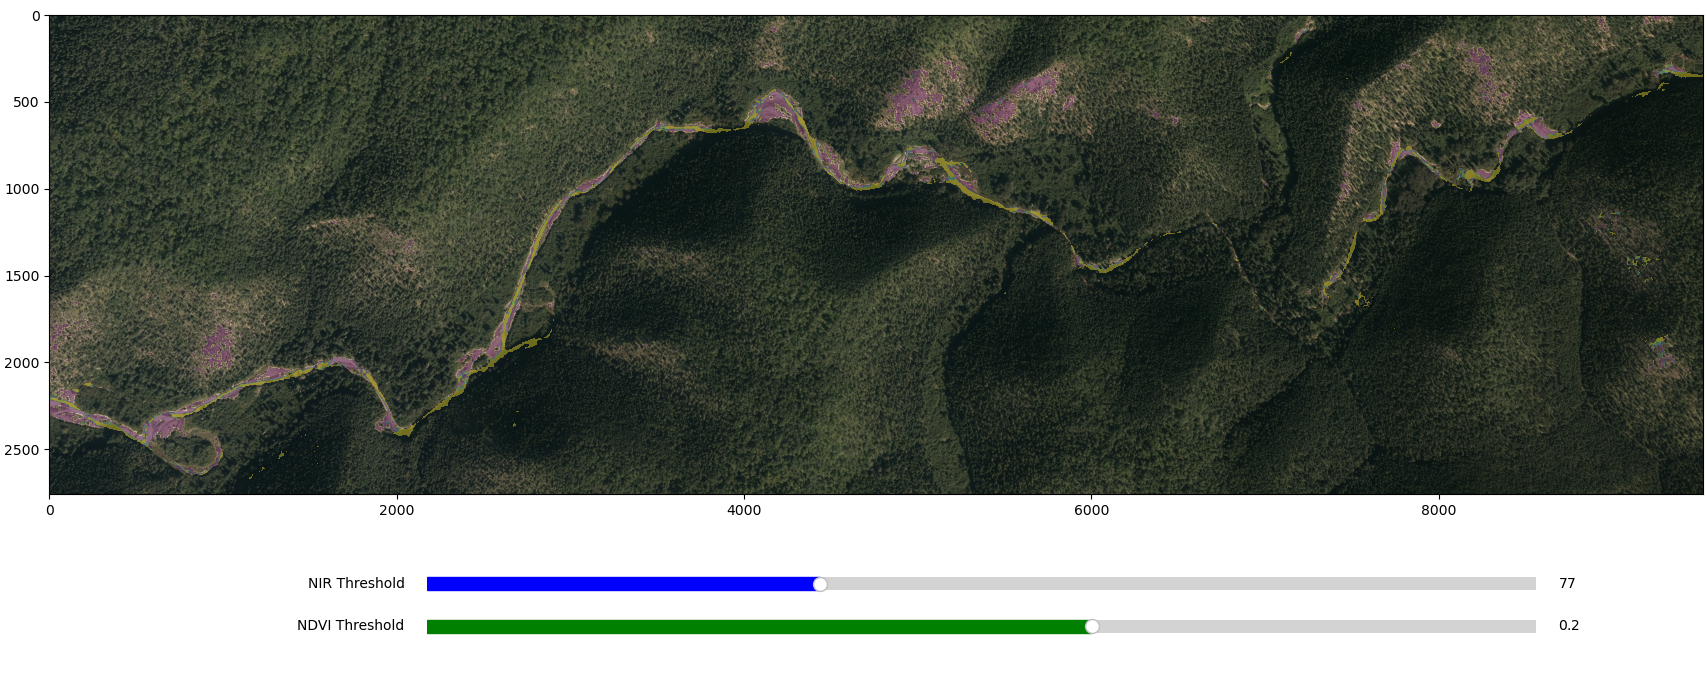
In this figure, the red line represents the NIR threshold and the blue line represents the NDVI threshold. You can interactively move the sliders to find the best thresholds for the current photo. You can zoom in and out to check in more detail a particular area of interest.
If youre are satisfied with the selected thresholds, you just need to close the figure and the CSV file with the selected thresholds will be saved in the same folder as the image. The CSV strcuture should look like the following:
image_name,ndvi,nir
q16039_162_30cm_f05,0.2472023192585575,100